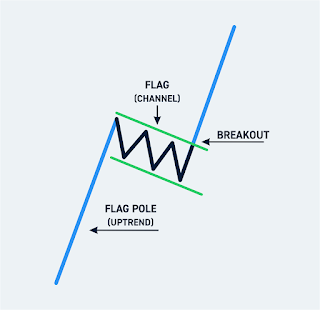
Flag Pattern
The flag's chart pattern is shaped like a sloping rectangle,where the support and resistance lines are parallel until the reis a breakout.The breakout is usually in the opposite direction of the trendlines,which means it is a ninversion pattern.
Like the pennant,the pattern of the flag is based on the consolidation of the market price of a particular stock.Consolidation will have an arrow range and will occurright after a rapid upward movement.Like the pennant,this model has a “pole” flag,which can represent a vertical price fluctuation.These fluctuations can be bearish and bullish,and if you know how to spot these patterns it can give an invest or a great advantage. If you think you have spotted a flag to trade,the most important factor is the rapid and steep price trend.If the price action slowly rises and falls below the flag,then you had better look elsewhere.


